2021 Q1 High Yield Quarterly
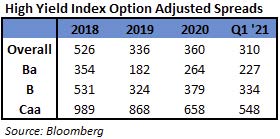
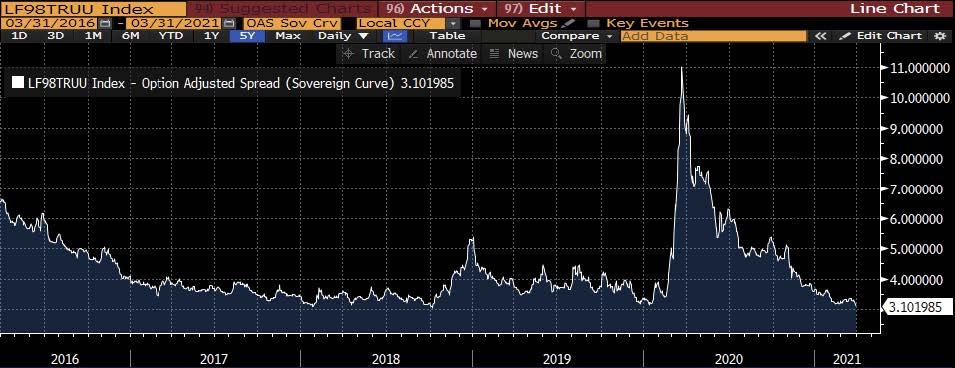
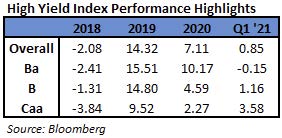
In the first quarter of 2021, the Bloomberg Barclays US Corporate High Yield Index (“Index”) return was 0.85% while the CAM High Yield Composite gross total return was -0.01%. The S&P 500 stock index return was 6.17% (including dividends reinvested) over the same period. The 10 year US Treasury rate (“10 year”) had a steady upward move as the rate finished at 1.74%, up 0.83% from the beginning of the quarter. During the quarter, the Index option adjusted spread (“OAS”) tightened 50 basis points moving from 360 basis points to 310 basis points. Each quality segment of the High Yield Market participated in the spread tightening as BB rated securities tightened 38 basis points, B rated securities tightened 46 basis points, and CCC rated securities tightened 110 basis points. Take a look at the chart below from Bloomberg to see a visual of the spread moves in the Index over the past five years. The graph illustrates the speed of the spread move in both directions during 2020 and the continuation of lower spreads in 2021.
The Transportation, Energy, and Other Industrial sectors were the best performers during the quarter, posting returns of 4.44%, 3.60%, and 2.08%, respectively. On the other hand, Utilities, Banking, and Insurance were the worst performing sectors, posting returns of -1.75%, -0.43%, and -0.39%, respectively. At the industry level, oil field services, retail REITs, refining, and airlines all posted the best returns. The oil field services industry posted the highest return (13.00%). The lowest performing industries during the quarter were health insurance, railroads, supermarkets, and wirelines. The health insurance industry posted the lowest return (-1.34%).
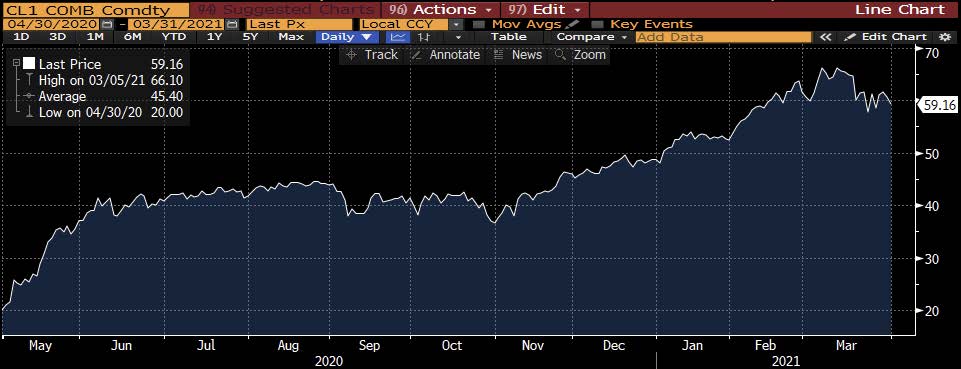
The energy sector performance has picked up where last year left off and has continued to be quite positive to start 2021. As can be seen in the chart to the left, the price of crude has continued its upward trajectory during the quarter. Recently, OPEC+ members agreed to start increasing oil production. They are making a bet on a continued economic rebound by deciding to add more than 2 million barrels a day as summer approaches. “Even in those sectors that were badly hit such as airline travel, there are signs of meaningful improvement,” said Saudi Energy Minister Prince Abdulaziz bin Salman.i
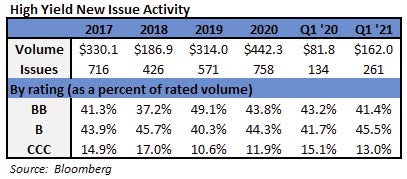
During the first quarter, the high yield primary market posted $162.0 billion in issuance. Many companies continued to take advantage of the open new issue market, and the quarter now holds the top spot for the busiest quarter on record. Issuance within Consumer Discretionary was the strongest with approximately 26% of the total during the quarter. Consumer Discretionary has now had the most issuance for the last four consecutive quarters. Over that time frame, Consumer Discretionary has accounted for approximately 25% of the issuance. Communications has accounted for approximately 13% and good enough for second place.
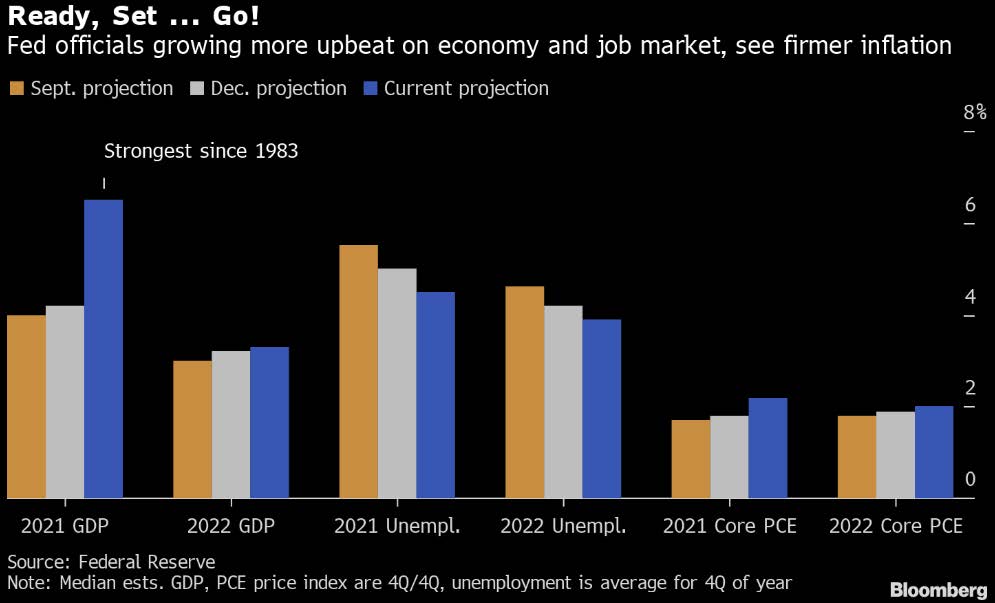
The Federal Reserve maintained the Target Rate to an upper bound of 0.25% at both the January and March meetings. The chart to the left gives a snapshot of how the Fed’s projections have changed for three economic data points. While broad market consensus is also quite upbeat on the economic outlook, market participants have pushed up the 10-year Treasury yield more than triple off the 0.51% low seen in August 2020. In the face of this, the Fed is content to keep a very accommodative posture. Federal Reserve Chair Jerome Powell said in a recent interview, “So, we will — very, very gradually, over time, and with great transparency, when the economy has all but fully recovered — we will be pulling back the support that we provided during emergency times.”ii
Intermediate Treasuries increased 83 basis points over the quarter, as the 10-year Treasury yield was at 0.91% on December 31st, and 1.74% at the end of the first quarter. The 5-year Treasury increased 58 basis points over the quarter, moving from 0.36% on December 31st, to 0.94% at the end of the first quarter. Intermediate term yields more often reflect GDP and expectations for future economic growth and inflation rather than actions taken by the FOMC to adjust the Target Rate. The revised fourth quarter GDP print was 4.3% (quarter over quarter annualized rate). Looking forward, the current consensus view of economists suggests a GDP for 2021 around 5.7% with inflation expectations around 2.4%.iii
Being a more conservative asset manager, Cincinnati Asset Management Inc. does not buy CCC and lower rated securities. This policy generally served our clients well in 2020. However, the lowest rated segment of the market outperformed in the first quarter of 2021. Thus, our higher quality orientation was not optimal during the period. As a result and noted above, our High Yield Composite gross total return did underperform the Index over the first quarter measurement period. With the market staying positive during the first quarter, our cash position remained a drag on overall performance. Additionally, our credit selections within the consumer non-cyclical sector were a drag on performance. Within the energy sector, our higher quality selections were considered a negative to relative performance as the riskiest segment of the sector performed extraordinarily well. Benefiting our performance was our underweight in the utilities sector. Further, our overweight in the transportation sector, and our credit selections within that sector were a positive.
The Bloomberg Barclays US Corporate High Yield Index ended the first quarter with a yield of 4.23%. This yield is up from the new record low of 3.89% reached in mid-February of this year. The market yield is an average that is barbelled by the CCC-rated cohort yielding 6.55% and a BB rated slice yielding 3.40%. Equity volatility, as measured by the Chicago Board Options Exchange Volatility Index (“VIX”), had an average of 23 over the quarter.
For context, the average was 15 over the course of 2019 and 29 for 2020. The first quarter had 4 bond issuers default on their debt. The trailing twelve month default rate was 4.80% with the energy sector accounting for a large amount of the default volume. Excluding the energy sector from the calculation drops the trailing twelve month default rate to 2.55%.iv The current 4.80% default rate is relative to the 3.35%, 6.19%, 5.80%, 6.17% default rates for the first, second, third, and fourth quarters of 2020, respectively. Pre-Covid, fundamentals of high yield companies had been mostly good and with the strong issuance in each of the last four quarters, companies have been doing all they can to bolster their balance sheets. From a technical view, fund flows did turn negative in February and March, and the year-to-date outflow stands at $4.6 billion.v High yield certainly had some volatility in 2020; however, the market did ultimately provide a positive total return. We are of the belief that for clients that have an investment horizon over a complete market cycle, high yield deserves to be considered as part of the portfolio allocation.
The 2020 High Yield Market was definitely one for the history books. The actions by the Treasury and the Federal Reserve no doubt helped to put in a bottom and provide a backstop for the capital markets to begin functioning amid the Covid pandemic. Generally speaking, the market has recovered. Additionally, the economy is projected to have solid growth over the course of 2021 given the trillions of stimulus that has been put into the system. The vaccine rollout continues and according to the CDC, 32% of the US population has received at least one shot. President Biden recently laid out a $2.25 trillion US infrastructure proposal. Headlines of political wrangling are likely to be front and center this year and perhaps provide some market opportunities. Clearly, it is important that we exercise discipline and selectivity in our credit choices moving forward. We are very much on the lookout for any pitfalls as well as opportunities for our clients. We will continue to carefully monitor the market to evaluate that the given compensation for the perceived level of risk remains appropriate on a security by security basis. It is important to focus on credit research and identify bonds of corporations that can withstand economic headwinds and also enjoy improved credit metrics in a stable to improving economy. As always, we will continue our search for value and adjust positions as we uncover compelling situations. Finally, we are very grateful for the trust placed in our team to manage your capital through such a historic time.
This information is intended solely to report on investment strategies identified by Cincinnati Asset Management. Opinions and estimates offered constitute our judgment and are subject to change without notice, as are statements of financial market trends, which are based on current market conditions. This material is not intended as an offer or solicitation to buy, hold or sell any financial instrument. Fixed income securities may be sensitive to prevailing interest rates. When rates rise the value generally declines. Past performance is not a guarantee of future results. Gross of advisory fee performance does not reflect the deduction of investment advisory fees. Our advisory fees are disclosed in Form ADV Part 2A. Accounts managed through brokerage firm programs usually will include additional fees. Returns are calculated monthly in U.S. dollars and include reinvestment of dividends and interest. The index is unmanaged and does not take into account fees, expenses, and transaction costs. It is shown for comparative purposes and is based on information generally available to the public from sources believed to be reliable. No representation is made to its accuracy or completeness.
i Bloomberg April 1, 2021: OPEC+ to Ease Oil Output Cuts in Cautious Bet on Recovery
ii Bloomberg March 25, 2021: Powell Says Fed Won’t Stop Until US ‘All But Fully Recovered’
iii Bloomberg April 1, 2021: Economic Forecasts (ECFC)
iv JP Morgan April 1,, 2021: “Default Monitor”
v Wells Fargo April 2, 2021: “Credit Flows”
