2020 Q3 Investment Grade Commentary
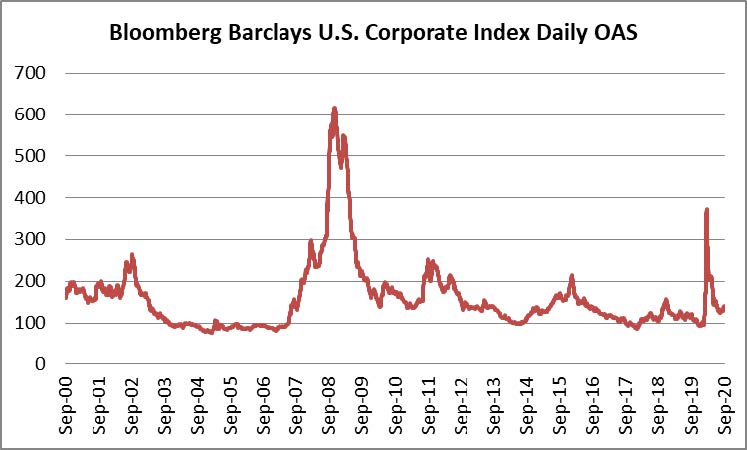
Corporate credit turned in a solid performance during the third quarter. Spreads were tighter, with the option adjusted spread on the Bloomberg Barclays U.S. Corporate Index opening the quarter at 150 and closing the quarter at 136. Treasuries were almost unchanged on the quarter with the 10yr Treasury opening at 0.66% and closing at 0.68%, but that does not tell the whole story of the volatility that was experienced throughout the period. The 10yr closed as low as 0.51% on August 4th and as high as 0.75% on August 27th with the average coming in at 0.64%. The Corporate Index posted a total return of +1.54% during the quarter with a year-to-date tally of +6.64%. This compares to CAM’s gross quarterly total return of +1.76% and year-to-date gross return of +6.74%.
Investment Grade Bonds – Where is The Value?
We have been at this a long time and the lightning quick risk reversal we have experienced in 2020 is the type of thing that only comes around once every decade or so. Going back to March 20, the Corporate Index closed that day with a year-to-date total return of -10.58%, but quickly rebounded over +17.2% through the end of the third quarter, a period of just over 6 months from the low. In March, the risk reward for corporate credit was very attractive, especially for extremely high quality A-rated credit. The spread on the Corporate Index traded north of 370 during the spring malaise, a level not seen since the financial crisis in early 2009, which is the last time we saw such a tremendous spread rally.
Now that the market has rallied so far so fast, clients are asking about the valuation of IG credit. Some clients are even wondering if it is worth owning IG bonds at all. For most investors, it is important to remember that IG credit is but one part of a well-diversified portfolio. Most of our clients own IG credit as a way to generate income, diversify away from equities or dampen overall portfolio volatility. We think that IG credit is still attractive for a few reasons and that the asset class still has a key part to play in an investor’s overall asset allocation.
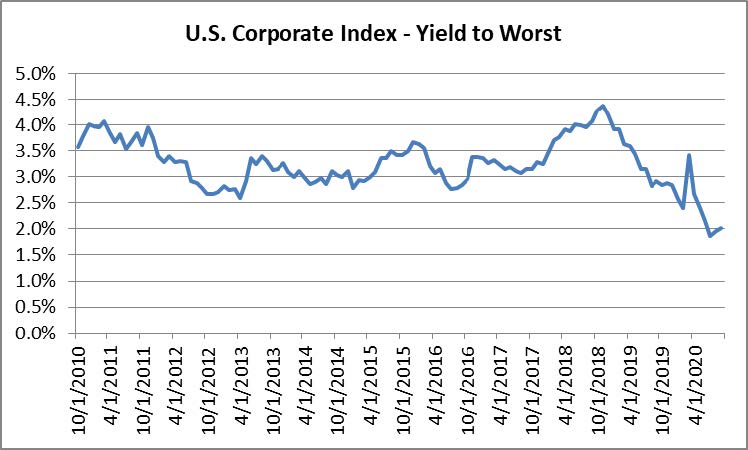
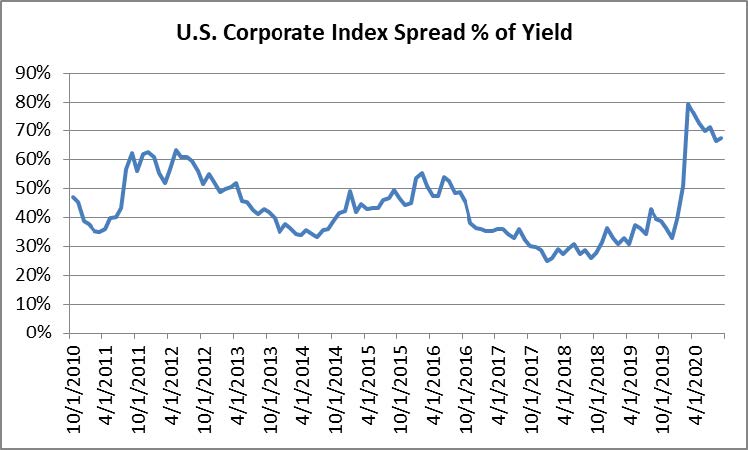
Spreads still present opportunity in our view, particularly when looking at the percentage of yield that is comprised of credit spread. Remember that there are two components of yield as a corporate bond investor: the yield of the underlying Treasury at the time of purchase and the corporate credit spread on top of that Treasury yield. For example if the purchase of a security occurred while the 10yr Treasury was 0.70% and the corporate credit spread of the security was trading at 200 basis points then the yield to maturity for that particular bond purchase would be 2.70%. In this case we would calculate the spread component of our overall yield by dividing 200/270bps arriving at a figure of 0.74%, which is very high by historical standards.
As you can see from the above charts, as the yield on the index has fallen, the percentage of yield that is comprised of credit spread has risen. This gives us two items that make us feel reasonably optimistic about the current level of spreads. If the economy is slow to recover from the pandemic, and Treasury rates remain near historical lows for an extended period, then spreads could well grind tighter, to a ratio that is more in line with the historical level of compensation relative to interest rates. On the other hand, if the economy recovers more quickly than the market currently anticipates, then we would expect a gradual increase in interest rates toward pre-pandemic levels. In the “quicker recovery” scenario, because the economy would be improving, then the path of least resistance would be tighter credit spreads which would help to offset rising interest rates. Recall that the spread on the index opened the year at 93 versus 136 at the end of the third quarter, so it is not hard to imagine tighter credit spreads from current levels amid an environment of more robust economic growth.
We are also monitoring several technical tailwinds that could be supportive of credit spreads for the remainder of 2020 and beyond. First, investor demand for corporate credit has been robust in 2020, with over $203 billion in net inflows into high grade funds through the end of the third quarteri. Second, there has been a resurgence in the foreign bid for $USD credit. The Bloomberg Barclays Global Aggregate Negative Yielding Debt Index closed September at -$15.5 trillion, not terribly far from its all-time high of -$17 trillion in August of 2019. Asia is one of the largest buyers of $USD IG credit and overnight Asian buying has been substantially positive every month for the past year and Asian demand was especially large in March, April and May of this yearii. Third and finally, we are looking for supply to slow substantially going forward. 2020 has seen a tidal wave of new issue supply as companies have been keen to meet the aforementioned investor demand with new corporate bond issuance. Through the end of the third quarter, companies had issued a record breaking $1.542 trillion in new debt, +67% ahead of 2019’s paceiii. The level of issuance has been so robust that it is unlikely to keep pace going forward as companies have largely completed their liquidity boosting and refinancing endeavors. We expect that companies in certain sectors that are more exposed to the economic slowdown will continue to tap the market for liquidity, but we do not anticipate nearly as much supply from those in less affected sectors. Not only that, but M&A activity is typically a large driver of supply, and it has dwindled to a standstill amid pandemic-related uncertainly. Of 200 IG deals in the 3rd quarter, fewer than 10 were tied to acquisitions bringing the year-to-date total to 20 acquisition-related deals versus 31 over the same time period in 2019<sup>iv</sup>. Less new issue supply often creates an environment that is supportive of credit spreads as investors must put their money to work in existing bonds.
Understanding the Risks
Opportunities are not without risk. Some risks loom large, like presidential and congressional elections that are just around the corner that will determine the direction of the country for the next several years. Risks related to the elections are less about the market as a whole and more about individual securities and how they may be impacted by things like tightening or loosening of restrictions related to climate change, financial regulation or changes at the Federal Reserve which could ultimately affect monetary policy. This is where bottom up credit research comes in. Our thorough research process and relatively concentrated portfolio means we are well aware of how current and potential investments might be impacted and we eschew those investments that are exposed to adverse outcomes. As far as the Federal Reserve is concerned, there is little worry about near term changes in policy as Chairman Jerome Powell’s term does not expire until February 2022 and the prevailing thought is that he would be nominated for an additional 4-year term by either presidential candidate.
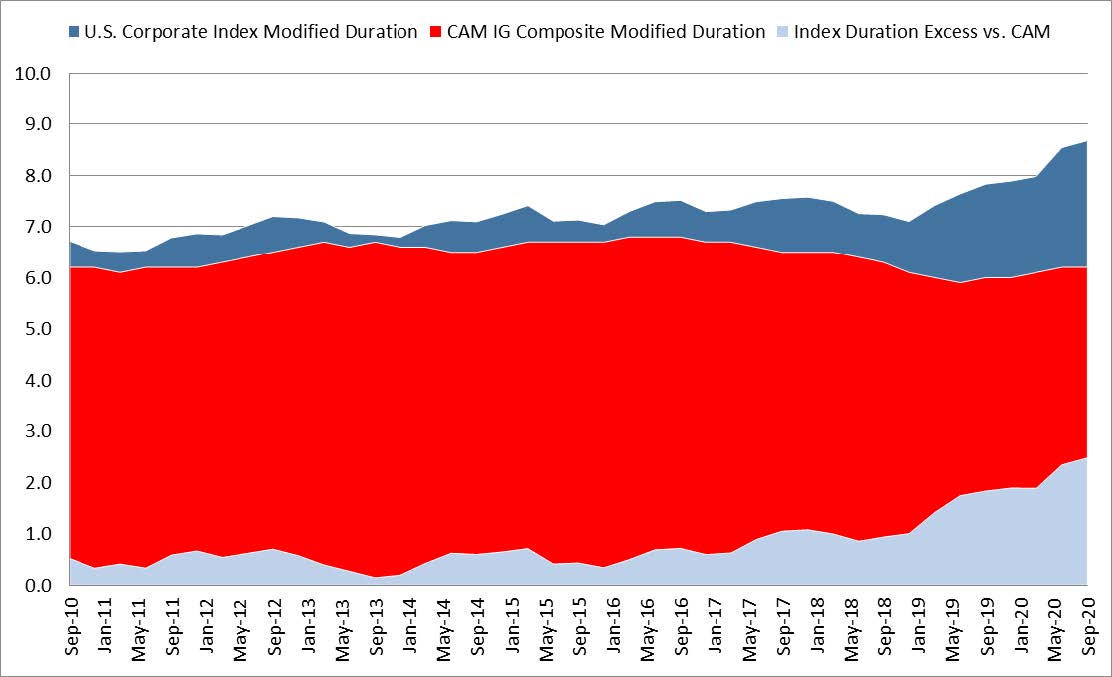
An emerging risk for passive fixed income investors that has received little attention in our opinion is the increasing duration of the investment grade corporate bond universe. In the past decade, the Bloomberg Barclays Corporate Index has seen its modified duration increase from 6.7 to 8.7 years. Revisiting the concept of duration, all else being equal, if the duration is 8.7 years, then a 100 basis point linear increase in interest rates would yield an 8.7% loss of value for a portfolio invested in the index. Investors in passively managed index portfolios probably do not realize that they are exposed to almost 30% more interest rate risk than they were incurring for the same investment just 10 years ago.
CAM’s modified duration change over the past 10 years was unchanged at 6.2 years and CAM’s duration was 2.5 years shorter than the index at the end of the third quarter. Now, CAM’s duration did exhibit slight fluctuations over the most recent 10 years, but the average during that period was 6.4 years and the range of change over the preceding 10 years was just 0.9, less than half the index range of 2.2 years. The duration gap has clearly grown between CAM’s IG composite and the Index, especially over the past 2 years, as the Index has gradually seen its duration creep higher.
Why has the Corporate Index duration increased? Low interest rates have helped, but much of the change is driven by what we call reverse inquiry. That is, demand from long term institutional investors in the corporate bond space such as pensions, insurance companies and endowments who are extremely thirsty for yield. Company Treasury departments recognized this demand and happily obliged by issuing a higher percentage of longer term debt at rates that were attractive to the company and with enough yield to satiate the institutional investors. Debt maturing in 10 years or more now makes up one-third of the overall IG Index while debt maturing in 20 years or more has grown to 22.4%v.
Why has CAM’s duration exhibited such little change by comparison? As we have discussed many times before in these commentaries, you know exactly what you are going to get when it comes to our portfolio: intermediate maturities positioned in the 5-10 year portion of the yield curve. Rather than try and “guess” the direction of interest rates we will always position the portfolio in intermediate maturities as it has historically been the best place to be from a risk reward standpoint. For example, the 5/10 Treasury curve at the end of the third quarter was 41 basis points, or about 8.2 basis points of compensation or “roll down” per year earned from holding a 10 year security until the 5 year mark. The 10/30 Treasury curve was 77 basis points, or about 3.8 basis points of compensation per year from the 30 year to the 10 year mark. Thus the 5/10 curve was significantly steeper than the 10/30 curve, and this steepness is one of the reasons CAM favors intermediate maturities. The compensation afforded for the duration risk incurred by extending beyond 10 years does not offer good risk reward in our view. Additionally, there are corporate credit curves that trade on top of these Treasury curves and these corporate curves tell a similar story. At the end of the third quarter the average A2 rated industrial bond traded at a credit spread of +45 to the 5yr, +89 to the 10yr and +125 to the 30yr. Thus the A2 industrial 5/10 curve was 44 basis points while the 10/30 curve was 36 basis pointsvi. This illustrates that an investor was being better compensated by moving from a 5yr corporate bond to a 10yr corporate bond than they were by moving from a 10yr corporate bond to a 30yr corporate bond. The major take away from this exercise is that Cincinnati Asset Management will not speculate on interest rates. Instead, we will continue to focus on the intermediate portion of the yield curve where we can add value through our robust bottom up research process and opportunistic credit selection.
Going forward we plan to stick to our script, as disciplined investors of your hard earned capital. We thank you for your interest and support. As always, please do not hesitate to contact us with any questions.
This information is intended solely to report on investment strategies identified by Cincinnati Asset Management. Opinions and estimates offered constitute our judgment and are subject to change without notice, as are statements of financial market trends, which are based on current market conditions. This material is not intended as an offer or solicitation to buy, hold or sell any financial instrument. Fixed income securities may be sensitive to prevailing interest rates. When rates rise the value generally declines. Past performance is not a guarantee of future results. Gross of advisory fee performance does not reflect the deduction of investment advisory fees. Our advisory fees are disclosed in Form ADV Part 2A. Accounts managed through brokerage firm programs usually will include additional fees. Returns are calculated monthly in U.S. dollars and include reinvestment of dividends and interest. The index is unmanaged and does not take into account fees, expenses, and transaction costs. It is shown for comparative purposes and is based on information generally available to the public from sources believed to be reliable. No representation is made to its accuracy or completeness.
i Wells Fargo Securities, October 1 2020, “Credit Flows: Supply & Demand: September 24-September 30”
ii Credit Suisse, October 2 2020, “CS Credit Strategy Daily Comment (IG September Recap)”
iii Bloomberg, September 30 2020, “IG ANALYSIS US: Mondelez Brings 5th Deal, Month Cracks Top Seven”
iv The Wall Street Journal, October 3 2020, “Credit Markets: Corporate Bond Sales Reach Record”
v Deutsche Bank Research, August 18 2020, “Is Duration Risk The New Credit Risk In IG?”
vi Raymond James, October 2 2020, “Fixed Income Spreads”


