2020 Q3 High Yield Quarterly
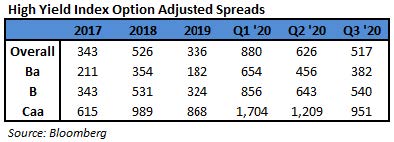
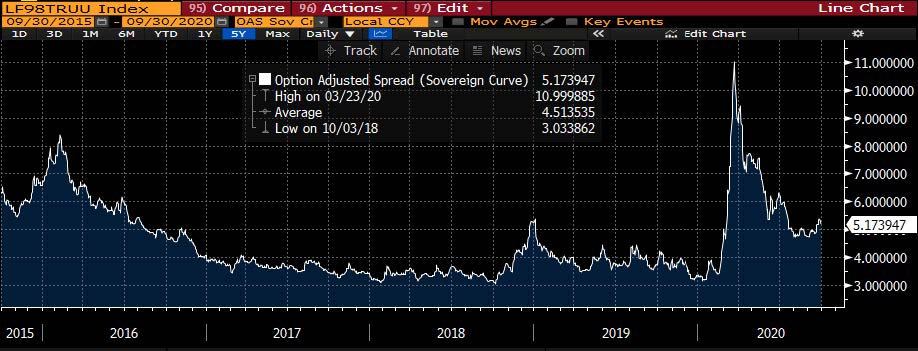
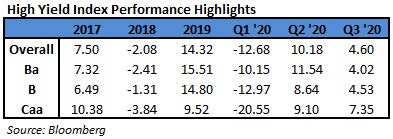
In the third quarter of 2020, the Bloomberg Barclays US Corporate High Yield Index (“Index”) return was 4.60% bringing the year to date (“YTD”) return to 0.62%. The CAM High Yield Composite gross total return for the third quarter was 4.56% bringing the YTD return to 2.60%. The S&P 500 stock index return was 8.93% (including dividends reinvested) for Q3, and the YTD return stands at 5.57%. The 10 year US Treasury rate (“10 year”) had a bit of range intra-quarter. However, the rate finished at 0.68%, up 0.02% from the beginning of the quarter. During the quarter, the Index option adjusted spread (“OAS”) tightened 108 basis points moving from 626 basis points to 517 basis points. During the third quarter, each quality segment of the High Yield Market participated in the spread tightening as BB rated securities tightened 74 basis points, B rated securities tightened 103 basis points, and CCC rated securities tightened 258 basis points. Take a look at the chart below from Bloomberg to see a visual of the spread moves in the Index over the past five years. The graph really shows the speed of the spread move in both directions during 2020.
The Transportation, Consumer Cyclical, and Other Industrial sectors were the best performers during the quarter, posting returns of 6.71%, 6.30%, and 6.10%, respectively. On the other hand, Utilities, Energy, and REITs were the worst performing sectors, posting returns of 2.92%, 3.06%, and 3.42%, respectively. At the industry level, aerospace/defense, airlines, leisure, and retailers all posted the best returns. The aerospace/defense industry (10.41%) posted the highest return. The lowest performing industries during the quarter were oil field services, refining, wireless, and health insurance. The oil field services industry (-10.51%) posted the lowest return.
The energy sector performance did go from a top performer last quarter to a bottom performer this quarter. However, as can be seen in the chart to the left, the price of crude held a fairly tight range throughout the quarter. There was a dip in price during the first part of September due in part to an uptick in inventories and demand concerns.i OPEC is “keeping supplies near the lowest level in decades to offset an unprecedented plunge in fuel demand.”ii Worldwide, UAE has made supply cuts in order to offset the increased drilling from Venezuela, Iraq, Libya, and others. On a net basis, output was held steady last month as OPEC attempts to keep the market in balance.
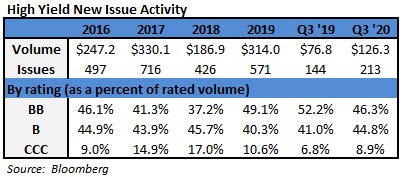
During the third quarter, the high yield primary market posted a massive $126.3 billion in issuance. Many companies continued to take advantage of the open new issue market in order to boost liquidity. Issuance within Consumer Discretionary was the strongest with approximately 21% of the total during the quarter. Consumer Discretionary was also the strongest last quarter with approximately 32% of the issuance. The massive amount of issuance and top weighting dropping to 21% indicates just how broad based the issuance was this quarter. With the enormous issuance during Q2 and Q3, 2020 has already set the record for most annual issuance.iii
The Federal Reserve maintained the Target Rate to an upper bound of 0.25% at both the July and September meetings. There were two voting members that dissented at the September meeting. It is important to note that neither dissent had to do with the current policy rate level but more the messaging for the out years. In late August, the Federal Reserve announced a major policy update “saying that it is willing to allow inflation to run hotter than normal in order to support the labor market and broader economy.”iv The Fed has cut back the level of corporate bond purchases fairly dramatically over time. At the start of the program, the average daily buying was $300 million. The last week of September showed average daily buying of about $29 million. However, there is little doubt that the Fed stands at the ready to support the markets as needed.
Intermediate Treasuries increased 2 basis points over the quarter, as the 10-year Treasury yield was at 0.66% on June 30th, and 0.68% at the end of the quarter. The 5-year Treasury decreased 1 basis point over the quarter, moving from 0.29% on June 30th, to 0.28% at the end of the quarter. Intermediate term yields more often reflect GDP and expectations for future economic growth and inflation rather than actions taken by the FOMC to adjust the Target Rate. There is no doubt that economic reports are going to be quite noisy over the balance of 2020. However, the revised second quarter GDP print was -31.4% (quarter over quarter annualized rate), and the current consensus view of economists suggests a GDP for 2020 around -4.4% with inflation expectations around 1.1%.
Being a more conservative asset manager, Cincinnati Asset Management is structurally underweight CCC and lower rated securities. This positioning has generally served our clients well so far in 2020. As noted above, our High Yield Composite gross total return has outperformed the Index over the year to date measurement period. With the market so strong during the third quarter, our cash position was the largest drag on our overall performance. Additionally, our credit selections within the consumer services industry were a drag on performance. While some of those selections contributed to a drag, our overweight positioning in the broader consumer sectors was a benefit as the recovery continued. Further, our underweight in the communications sector was a positive. Finally, our credit selections within the energy e&p and gaming industries provided an overall benefit to performance.
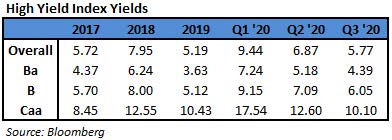
The Bloomberg Barclays US Corporate High Yield Index ended the third quarter with a yield of 5.77%. This yield is an average that is barbelled by the CCC-rated cohort yielding 10.10% and a BB rated slice yielding 4.39%. Equity volatility, as measured by the Chicago Board Options Exchange Volatility Index (“VIX”), held a range mostly between 20 and 30 over the quarter. For context, the average was 15 over the course of 2019. The third quarter had 12 bond issuers default on their debt. The trailing twelve month default rate was 5.80% and the energy sector accounts for almost half of the default volumev. This is up from the trailing twelve month default rate of 3.35% posted during the first quarter and down a bit from the 6.19% posted during the second quarter. Pre-Covid, fundamentals of high yield companies had been mostly good and with the strong issuance during Q2 and Q3, companies are doing all they can to bolster their balance sheets. From a technical perspective, fund flows have been robust, but there was an outflow for September. This was the first monthly outflow since March. Interestingly, the outflow was due to the ETF channel while the actively managed channel still had positive flows.vi High yield has certainly had some volatility this year; however the returns of the second and third quarters have recouped the loss sustained in the first quarter. For clients that have an investment horizon over a complete market cycle, high yield deserves to be considered in the portfolio allocation.
The High Yield Market is fairly bifurcated at this point. Therefore, the market is trading at elevated spread levels, and it is important that we exercise discipline and selectivity in our credit choices moving forward. We are very much on the lookout for any pitfalls as well as opportunities for our clients. As we go to print, the President and First Lady have tested positive for Covid-19 and an additional stimulus package is being worked out in Washington. These items among others, in addition to the election, should make the fourth quarter no less eventful than the first three quarters of 2020. We will continue to carefully monitor the market to evaluate that the given compensation for the perceived level of risk remains appropriate on a security by security basis. It is important to focus on credit research and buy bonds of corporations that can withstand economic headwinds and also enjoy improved credit metrics in a stable to improving economy. As always, we will continue our search for value and adjust positions as we uncover compelling situations. Finally, we are very grateful for the trust placed in our team to manage your capital through such an unprecedented time.
This information is intended solely to report on investment strategies identified by Cincinnati Asset Management. Opinions and estimates offered constitute our judgment and are subject to change without notice, as are statements of financial market trends, which are based on current market conditions. This material is not intended as an offer or solicitation to buy, hold or sell any financial instrument. Fixed income securities may be sensitive to prevailing interest rates. When rates rise the value generally declines. Past performance is not a guarantee of future results. Gross of advisory fee performance does not reflect the deduction of investment advisory fees. Our advisory fees are disclosed in Form ADV Part 2A. Accounts managed through brokerage firm programs usually will include additional fees. Returns are calculated monthly in U.S. dollars and include reinvestment of dividends and interest. The index is unmanaged and does not take into account fees, expenses, and transaction costs. It is shown for comparative purposes and is based on information generally available to the public from sources believed to be reliable. No representation is made to its accuracy or completeness.
i Bloomberg September 10, 2020: “Oil Falls With Growing U.S. Crude Supplies and Fuel Demand Fears”
ii Bloomberg October 1, 2020: “OPEC Output Steady as UAE Cut Offsets Gains in Troubled Members”
iii Bloomberg October 1, 2020: “Junk Bonds Set Another Sales Record with Busiest September Ever”
iv CNBC August 27, 2020: “Powell Announces New Fed Approach”
v JP Morgan October 1, 2020: “Default Monitor”
vi JP Morgan October 1, 2020: “High Yield Bond Monitor”
