2019 Q3 INVESTMENT GRADE QUARTERLY
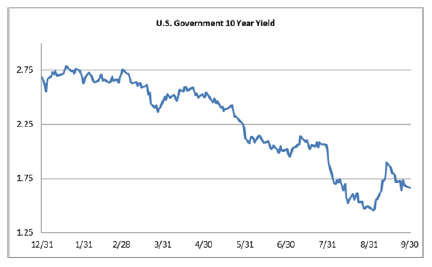
Investment grade credit markets have continued to enjoy strong performance in 2019, although spreads showed little movement during the third quarter. The Bloomberg Barclays US Corporate Index closed the quarter at an option adjusted spread of 115, which is exactly where it opened. Coupon income and lower Treasury yields were the driving forces of positive returns during the quarter as the 10yr Treasury finished the quarter at 1.66% after having opened at 2.01%. While Treasuries finished lower, the path was not linear and there was volatility along the way: the 10yr closed at a low of 1.45% on September 3, before rocketing higher to close at 1.89% on September 13, a massive move of 44 basis points over the course of just eight trading days. Corporate bond returns are off to the best start through the first three quarters of any calendar year dating back to 2009 when the US Corporate Index posted a total return of +17.11%. Through the first 9 months of 2019 the Bloomberg Barclays US Corporate Index had a total return of +13.20%. This compares to CAM’s gross total return of +11.69% for the Investment Grade Strategy.
The Primary Market is Back, Bigly
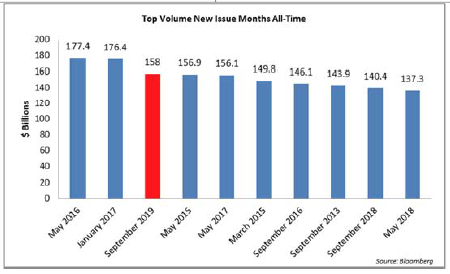
Lower Treasuries, retail fund flows and foreign buyers who were faced with increasingly negative yields in many local markets combined to lead a resurgence in the primary market during the quarter.
September was one for the record books as companies issued $158bln in debt, making it the 3rd largest volume month in the history of the corporate bond market. According to data compiled by Bloomberg, issuance through the end of the third quarter stood at $923.6bln, trailing 2018’s pace by 3.9%.
Portfolio Positioning
While we at CAM are pleased with the year‐to‐date performance of our investment grade strategy, we would like to remind our investors that this performance has occurred over a very short timeframe. We strategically position our clients’ portfolios with a longer term focus and an emphasis on providing a superior risk‐adjusted return over a full market cycle. Amid such a strong start to the year for credit, we would like to illustrate to our investors how we are positioning portfolios for the longer term. While we do not seek to replicate or manage to an index, we do use the Bloomberg Barclays US Corporate Index as a benchmark for the performance of our strategy so this discussion will refer to that index as a tool to compare our relative positioning.
Credit Quality
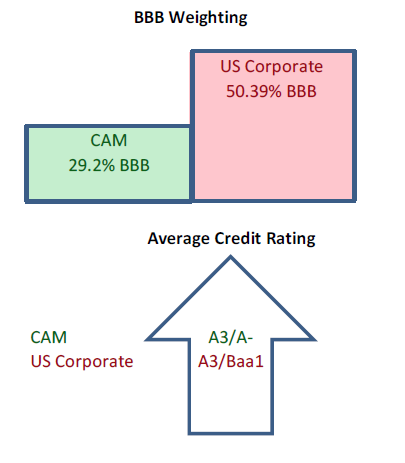
CAM targets a 30% limitation for BBB exposure, the riskiest portion of the investment grade universe. There is an additional target of maintaining an overall portfolio credit quality rating of at least A3/A‐. The US Corporate Index was 50.39% BBB‐rated at the end of the third quarter with an average rating of A3/Baa1. While this high‐quality bias can cause CAM’s portfolio to underperform during periods of excessive risk taking, it should tend to outperform during periods of market stress. One of the tenets of our strategy is preservation of capital and our BBB‐underweight is helpful in achieving this goal for our investors.
Interest Rate Sensitivity
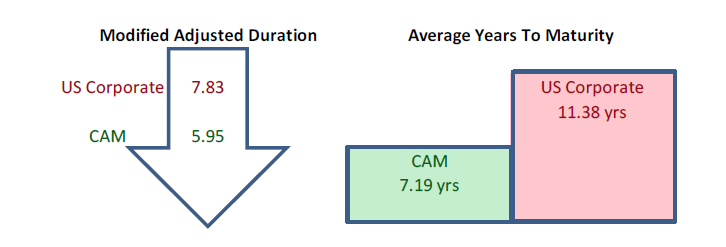
CAM avoids the fool’s errand of attempting to make tactical bets on the direction of interest rates. Instead we manage interest rate risk by positioning the portfolio in intermediate bonds that range in maturity from 5‐10 years. CAM will occasionally hold a security that is shorter than 5 years or longer than 10, but very rarely does so. By always investing in intermediate maturities, CAM’s seasoned portfolio is more conservatively positioned than the corporate index with a shorter duration and fewer average years to maturity.
Liquidity
Liquidity is always on our minds at CAM. Maintaining an intermediate maturity profile requires that we sell bonds prior to maturity so we must be sure that we will be able to effectively exit positions. CAM targets SEC‐registered securities that have $300 million minimum par amount outstanding.
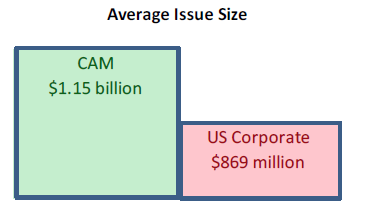
Additionally CAM attempts to cap its ownership exposure to 5% of any particular issue. By investing in larger more liquid issues and by limiting exposure to any particular issue it makes it easier to achieve best execution when it comes time to sell. CAM’s US Corporate average ownership exposure per issue held at the $869 million end of the third quarter was 0.7%.
Diversification & Industry Sector Limitations
CAM diversifies client accounts by populating individual separately managed accounts with 20‐25 positions. Additionally CAM imposes a 20% exposure limitation at the “sector” level and a 15% limitation at the “industry” level. As an example, “Capital Goods” is at the sector level and beneath that sector there are individual buckets at the industry level, such as Building Materials.
CAM invests in bonds that we believe will add value to the performance of the portfolio. Because CAM does not manage to, or attempt to, replicate an index it does not encounter the problem of over‐diversification or of owning the bonds of an issuer simply because the issuer represents a large weighting within an index.
The Fed Strikes Again, Now What?
The FOMC lowered its target for the Federal Funds Rate twice during the quarter, once at its July meeting and then again in September. The current implied probability of a cut at its meeting at the end of October is around 60% but closer to 75% for the December meeting, as market participants’ views remain mixed on the possibility of further cuts in 2019. We believe that the Fed will abide by its commitment to data dependency. Economic data showing strength or resiliency will result in no further cuts in 2019, but data showing a deteriorating economic picture could mean that more cuts are on the horizon.
In our view, the biggest factor for the performance of risk markets through year end hinges on trade. We believe that the markets are pricing in a China trade resolution over the medium term. If this does not come to fruition or if the U.S. and China become more antagonistic then a negative market reaction becomes more likely. Aside from being positioned more conservatively than the market as a whole, with considerably less BBB exposure and a markedly shorter duration, we believe that we are furthermore better positioned regarding general economic sensitivity as well as, more specifically, Chinese trade exposure.
While the investment grade credit market has performed well, caution still rules the day. We will continue to position portfolios accordingly with an eye toward the longer term. Thank you for entrusting us with the responsibility of helping you to achieve your financial goals.
This information is intended solely to report on investment strategies identified by Cincinnati Asset Management. Opinions and estimates offered constitute our judgment and are subject to change without notice, as are statements of financial market trends, which are based on current market conditions. This material is not intended as an offer or solicitation to buy, hold or sell any financial instrument. Fixed income securities may be sensitive to prevailing interest rates. When rates rise the value generally declines. Past performance is not a guarantee of future results. Gross of advisory fee performance does not reflect the deduction of investment advisory fees. Our advisory fees are disclosed in Form ADV Part 2A. Accounts managed through brokerage firm programs usually will include additional fees. Returns are calculated monthly in U.S. dollars and include reinvestment of dividends and interest. The index is unmanaged and does not take into account fees, expenses, and transaction costs. It is shown for comparative purposes and is based on information generally available to the public from sources believed to be reliable. No representation is made to its accuracy or completeness.
