2018 Q3 High Yield Commentary
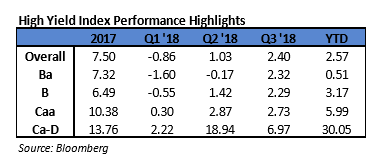
In the third quarter of 2018, the Bloomberg Barclays US Corporate High Yield Index (“Index”) return was 2.40%. For the year, the Index return was 2.57%. The 10 year US Treasury rate (“10 year”) was mostly range bound during the quarter oscillating between 2.8% and 3.0%. However, around mid-September, the 10 year started moving higher and reached a high of 3.1%. Back in mid-May the 10 year had a similar swing higher reaching 3.1% before moving back down to the 2.8% area. High Yield remains one of the best performing asset classes within fixed income, and CCC and lower rated securities continue to outperform higher quality counterparts. As we have stated many times previously, it is important to note that during 2008 and 2015, CCC rated securities recorded negative returns of 44.35% and 12.11%, respectively. We highlight these returns to point out that with outsized positive returns come outsized possible losses, and the volatility of the CCC rated cohort may not be appropriate for many clients’ risk profile and tolerance levels. During the quarter, the Index option adjusted spread (“OAS”) tightened 47 basis points moving from 363 basis points to 316 basis points. As a reminder, the Index spread broke the multi-year low of 323 basis points set in 2014 by reaching 311 basis points in late January. The longer term low of 233 basis points was reached in 2007. Mid-April 2018 had a low spread of 314 basis points essentially retesting the 311 spread of late January. Importantly, after the January low the OAS touched 369 basis points in February. Additionally, after the April low the OAS touched 372 basis points in May. Within the High Yield Market, opportunities can show up quite rapidly at times. During the third quarter, every quality grouping of the High Yield Market participated in the spread tightening as BB rated securities tightened 47 basis points, B rated securities tightened 60 basis points, and CCC rated securities tightened 14 basis points.
The Consumer Non-Cyclical, Communications, and Transportation sectors were the best performers during the quarter, posting returns of 3.20%, 3.19%, and 3.09%, respectively. On the other hand, Consumer Cyclical, Capital Goods, and Banking were the worst performing sectors, posting returns of 1.50%, -1.86%, and -1.89%, respectively. At the industry level, supermarkets, pharma, wireless, and cable all posted strong returns. The pharma industry (4.48%) posted the highest return. The lowest performing industries during the quarter were retail reits, office reits, lodging, and retailers. The retail reit industry (-0.13%) posted the lowest return.

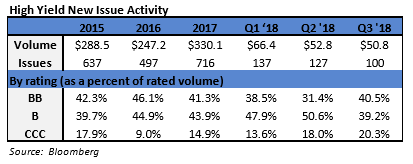
During the third quarter, the high yield primary market posted $50.8 billion in issuance. Issuance within Financials and Energy was quite strong during the quarter. The 2018 second quarter level of issuance was significantly less than the $72.9 billion posted during the third quarter of 2017. Year to date 2018 issuance has continued at a much slower pace than the strong issuance seen in 2017. The full year issuance for 2017 was $330.1 billion, making 2017 the strongest year of issuance since 2014. Year to date, the 2018 issuance pace is roughly 27% slower than the same measurement period in 2017.

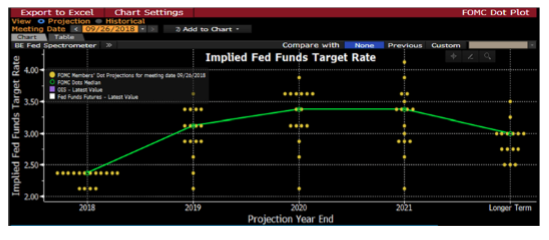
The Federal Reserve held two meetings during Q3 2018. The Federal Funds Target Rate was raised at the September 26th meeting. Reviewing the dot plot from Bloomberg that shows the implied future target rate, the Fed is expected to increase one more time in 2018 and three more times in 2019. However, based off certain trading levels, the market implied policy rate is projected to be lower than current Fed projections.i Some market concern has risen about the yield curve possibly inverting. However, New York Fed President John Williams was quoted “We need to make the right decision based on our analysis of where the economy is and where it’s heading in terms of our dual-mandate goals. If that were to require us to move interest rates up to the point where the yield curve was flat or inverted, that would not be something I would find worrisome on its own.” While the Target Rate increases tend to have a more immediate impact on the short end of the yield curve, yields on intermediate Treasuries increased 20 basis points over the quarter, as the 10-year Treasury yield was at 2.86% on June 30th, and 3.06% at the end of the quarter. The 5-year Treasury increased 21 basis points over the quarter, moving from 2.74% on June 30th, to 2.95% at the end of the quarter. Intermediate term yields more often reflect GDP and expectations for future economic growth and inflation rather than actions taken by the FOMC to adjust the Target Rate. Inflation as measured by core CPI has been moving steadily higher during 2018 from 1.8% to 2.2% as of the September 13th report. The revised second quarter GDP print was 4.2% (QoQ annualized rate). While this print undoubtedly contained some transitory factors due to tax reform, the average of the last four GDP prints stands at a solid 3.08%. The consensus view of most economists suggests a GDP for 2018 in the upper 2% range with inflation expectations at or above 2%.

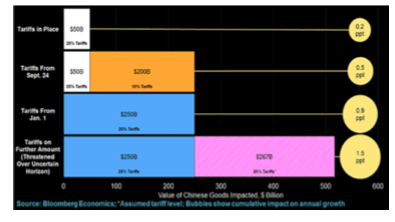
A major theme in the third quarter was US trade negotiations. As stated in our previous commentary, trade remains a risk as the global status quo continues to be shaken up. At the end of August, the North American Free Trade Agreement (“NAFTA”) revamp was making headlines. The United States and Mexico had reached a new agreement but, at the time, an agreement could not be reached with Canada. Many business leaders and members of Congress made clear that Canada must be part of the equation going forward.ii Canada finally reached an agreement on the new US- Mexico-Canada Agreement (“USMCA”) just before the deadline at midnight on September 30th.iii While the USMCA negotiations are winding down, the trade negotiation with China is heating up. The United States has imposed tariffs on Chinese goods and China has responded with their own retaliatory tariffs.iv At this juncture, the economic impact is small but the risk of escalation is present and must be monitored.

Being a more conservative asset manager, Cincinnati Asset Management remains significantly underweight CCC and lower rated securities. For the third quarter, the focus on higher quality credits did bear fruit, but not enough to overcome the riskiest segment of the High Yield Market. While the CCC segment had only 14 basis points of spread tightening, the superior return was driven by a lower duration and higher coupon relative to the other rating categories within high yield. Our third quarter High Yield Composite gross total return under-performed the return of the Bloomberg Barclays US Corporate High Yield Index (2.09% versus 2.40%). Our underweight in the energy sector and the pharmaceuticals industry were a drag on our performance. Additionally, our credit selections with the consumer cyclical industries of services and leisure hurt performance. However, our overweight in the consumer non‐cyclical sector was a bright spot. Additionally, our credit selections within the midstream industry, capital goods sector, and other industrial sector were a benefit to performance.
The Bloomberg Barclays US Corporate High Yield Index ended the second quarter with a yield of 6.24%. This yield is an average that is barbelled by the CCC rated cohort yielding 8.87% and a BB rated slice yielding 5.14%. While the yield of 6.24% is down a bit from the 6.49% of last quarter, it is up nicely from the 5.44% of Q3 2017. Equity volatility, as measured by the Chicago Board Options Exchange Volatility Index, has continued its downtrend from the first quarter of this year. High Yield default volume was very low during the third quarter. In fact, the default volume for the quarter was the second lowest quarterly total since Q4 2013. The twelve month default rate was 2.02% and only 1.29% when iHeart Communications is excluded from the total.v The current default rate remains significantly below the historical average. Additionally, fundamentals of high yield companies continue to be generally solid. Finally, from a technical perspective, supply remains low and rising stars are outnumbering falling angels by a wide margin. This positive backdrop is likely to provide support for the market especially as sizeable coupon payment demand begins to kick in towards the end of the year. Due to the historically below average default rates and the higher income available in the High Yield market, it is still an area of select opportunity relative to other fixed income products.
Over the near term, we plan to remain rather selective. When the riskiest end of the High Yield market begins to break down, our clients should accrue the benefit of our positioning in the higher quality segments of the market. The market needs to be carefully monitored to evaluate that the given compensation for the perceived level of risk remains appropriate on a security by security basis. It is important to focus on credit research and buy bonds of corporations that can withstand economic headwinds and also enjoy improved credit metrics in a stable to improving economy. As always, we will continue our search for value and adjust positions as we uncover compelling situations.
See Accompanying Endnotes
This information is intended solely to report on investment strategies identified by Cincinnati Asset Management. Opinions and estimates offered constitute our judgment and are subject to change without notice, as are statements of financial market trends, which are based on current market conditions. This material is not intended as an offer or solicitation to buy, hold or sell any financial instrument. Fixed income securities may be sensitive to prevailing interest rates. When rates rise the value generally declines. Past performance is not a guarantee of future results. Gross of advisory fee performance does not reflect the deduction of investment advisory fees. Our advisory fees are disclosed in Form ADV Part 2A. Accounts managed through brokerage firm programs usually will include additional fees. Returns are calculated monthly in U.S. dollars and include
reinvestment of dividends and interest. The index is unmanaged and does not take into account fees, expenses, and transaction costs. It is shown for comparative purposes and is based on information generally available to the public from sources believed to be reliable. No representation is made to its accuracy or completeness.
i Bloomberg September 19, 2018: “Bond Traders Move Closer to Fed”
ii New York Times August 27, 2018: “Trump Reaches Revised Deal With Mexico”
iii CNN October 1, 2018: “US and Canada reach deal on NAFTA”
iv Bloomberg September 18, 2018: “China Strikes $60 Billion of U.S. Goods in Growing Trade War”
v JP Morgan October 1,, 2018: “Default Monitor”