Q2 2018 Investment Grade Commentary
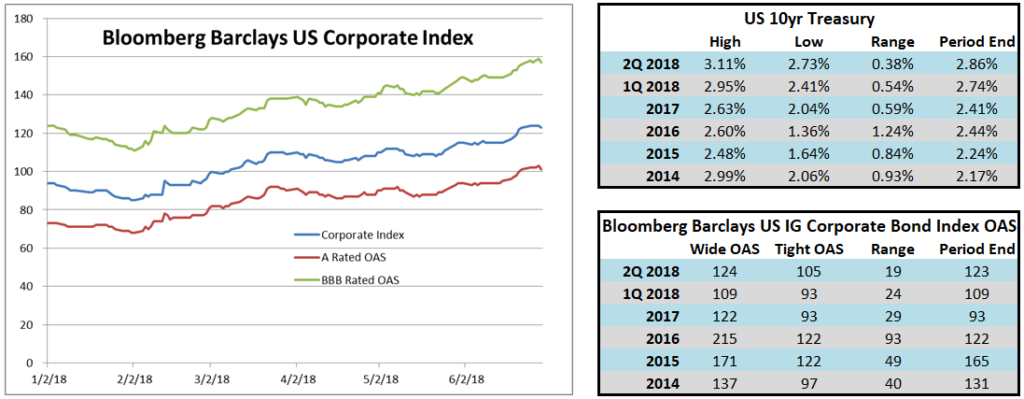
The second quarter of 2018 brought wider spreads and higher rates, which weighed on the performance of investment grade corporate credit. The Bloomberg Barclays US Corporate Index opened the quarter at a spread of 109 basis points over Treasuries and it finished the quarter at a spread of 123. Like spreads, Treasury rates were also higher on the quarter, as the 10yr Treasury rose as high as 3.11% on May 17th, before it finished the quarter at 2.86%, which was 0.12% higher than where it opened the quarter. Wider (higher) credit spreads and higher rates both have a negative impact on bond prices, which sometimes cannot fully be offset by the coupon income that is earned from a diversified corporate bond portfolio. The US Corporate Index posted a total return on the quarter of -0.98%. This compares to CAM’s gross return during the second quarter of -0.45%. Looking at YTD numbers, the corporate index posted a total return of -3.27% through the first 6 months of the year while CAM’s gross return was -2.94%. CAM outperformed the index during the quarter due in part to the fact that CAM’s portfolio is always positioned in intermediate maturities that generally range from 5 to 10 years. Treasury rates have moved higher thus far in 2018, and the index has a longer duration than CAM’s portfolio, so interest rates are more of a headwind for the corporate index relative to the intermediate positioning of CAM’s portfolio. Additionally, CAM has benefitted from the higher credit quality of its portfolio relative to the Corporate Index. CAM targets a weighting of 30% for its allocation to BBB-rated corporate credit, which is the riskier portion of the investment grade universe, while the index has a weighting of nearly 50% in BBB-rated credit.
Credit spreads finished the quarter near the widest levels of the year. The tightest level for spreads in 2018 was on Friday, February 2nd. Since that time, there has been significant dispersion in the performance of lower rated credit versus higher rated credit. From February 2nd until the end of the quarter on June 29th, the Corporate Bond Index was 38 basis points wider. During this same time period, single-A rated credit outperformed the index as a whole, as this higher quality portion of the index was 33 basis points wider while the BBB-rated portion of the index was a significant underperformer as it widened by 46 basis points. In other words, since the market low on February 2nd, A-rated credit spreads have outperformed BBB-rated credit spreads by 13 basis points. It is too early to tell if this quality performance dispersion is the making of a trend, but we at CAM are comfortable with our significant underweight to the riskier BBB-rated portion of the index, as we are not seeing enough value in riskier credit currently and believe that the balance between risk and reward is better served by staying overweight higher quality A-rated credit.


The Federal Reserve raised the Fed Funds Target Rate at its June meeting. This marks the 7th increase in the target since the current tightening cycle began in December of 2015. Our clients often ask us what we are doing in response to the Fed’s tightening cycle, which may call for an additional 1-2 rate hikes this year and as many as 3 in 2019. Our response is that we will continue to position the portfolio in intermediate maturities that range from 5-10 years until maturity. Generally speaking, we will allow bonds to roll down the curve until somewhere around the 5-year mark at which time it is often beneficial to sell that 5-year maturity and redeploy the proceeds into a more attractive opportunity that matures in 7-10 years. This cycle tends to repeat itself time and time again. We believe that the intermediate portion of the yield curve is the spot where investors are most appropriately compensated for credit risk and interest rate risk. An investor can earn a higher yield by investing in bonds that mature in 20 or 30 years but the extra compensation afforded for credit risk beyond 10 years is generally benign and an investor would also be taking on much more interest rate risk beyond 10 years. Rather than trying to “guess” the next move in interest rates, we position the portfolio in a predictable maturity band and focus our efforts on analyzing the prospects of individual companies that populate our portfolio.
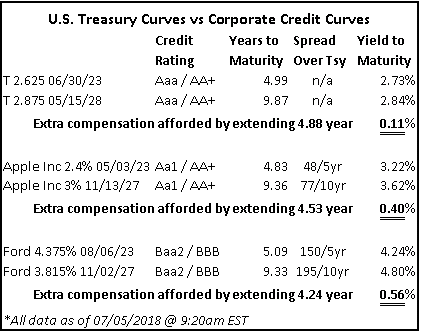
Much has been written and reported in the financial press with regard to the flattening of the yield curve. The Fed Funds Target Rate has a significant impact on Treasury rates in the 2-5 year range whereas the 7-10 year band of Treasury rates is more dependent on GDP and inflation expectations. The first target rate hike of the current cycle occurred in December of 2015. Since that time and until the end of the second quarter of 2018, the 2-year Treasury has moved 150 basis points higher and the 5-year has gone 100 basis points higher while the 10-year moved just 60 basis points higher. At the end of the second quarter, the 5/10 Treasury curve was 13 basis points, meaning the 10-year Treasury yield was only 13 basis points higher than the 5-year Treasury yield. The 10/30 Treasury curve was just as flat, at 13 basis points. Think of it this way, if you were to invest in a 30-year Treasury instead of a 10-year Treasury, you would only be earning 0.13% more; this hardly seems like very good compensation for a Treasury investor taking on an additional 20 years of maturity. We at CAM are corporate bond investors so it is important to note that, although corporate bonds trade at a spread over Treasuries, the corporate bonds themselves also have credit curves. Corporate bond curves tend to behave more rationally than Treasury curves and investors are typically more fairly compensated for taking on additional years of maturity. Corporate bond curves are organic in nature and ever changing. Higher quality A-rated corporate credits tend to have flatter curves whereas BBB-rated credits will have steeper curves. In the below example, you can see that the investor who extends in Apple or Ford credit receives 40 and 56 basis points of compensation respectively, while the Treasury investor receives only 11 basis points of compensation.


As we turn to the second half the year, we at CAM remain as cautious as ever. The U.S. economic expansion has entered its 10th year, but we must remember that this is a global economy[1]. While the global economy seems relatively good, growth has been low, and it would not take much to create a recessionary environment where risk assets could fare poorly. There are a number of risks that could impair global growth, most especially a trade conflict that has the potential to erupt into a global trade war. We continue to be selective in our investments, focusing on higher quality credits with sustainable competitive advantages that will allow them to thrive in a variety of economic environments. We are also favoring companies with management teams that have shown financial discipline during a prolonged low interest rate environment, as many management teams have been tempted by low borrowing costs and have piled debt on their balance sheets that could force them to refinance in an environment where borrowing costs are higher. In short, we will continue to add value for our clients by focusing on credit work and populating the portfolio with our best ideas within the realm of corporate credit.
This information is intended solely to report on investment strategies identified by Cincinnati Asset Management. Opinions and estimates offered constitute our judgment and are subject to change without notice, as are statements of financial market trends, which are based on current market conditions. This material is not intended as an offer or solicitation to buy, hold or sell any financial instrument. Fixed income securities may be sensitive to prevailing interest rates. When rates rise the value generally declines. Past performance is not a guarantee of future results. Gross of advisory fee performance does not reflect the deduction of investment advisory fees. Our advisory fees are disclosed in Form ADV Part 2A. Accounts managed through brokerage firm programs usually will include additional fees. Returns are calculated monthly in U.S. dollars and include reinvestment of dividends and interest. The index is unmanaged and does not take into account fees, expenses, and transaction costs. It is shown for comparative purposes and is based on information generally available to the public from sources believed to be reliable. No representation is made to its accuracy or completeness.
[1] The Wall Street Journal, July 2nd 2018 “Real Time Economics: The U.S. Economic Expansion Enters Its 10th Year… How Much Longer Does It Have?”