Q1 2018 High Yield Commentary
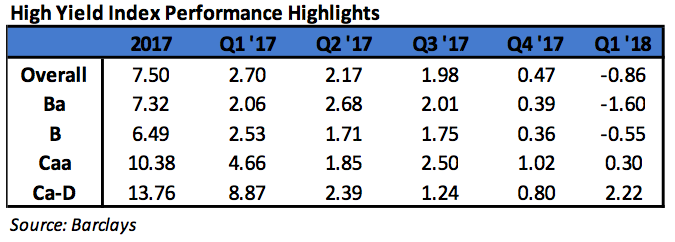
During the first quarter of 2018, the High Yield Market gave back a modest amount of the gains seen in 2016 & 2017. The first quarter return of the Bloomberg Barclays US Corporate High Yield Index (“Index”) return was ‐0.86%. While the total return was negative, the return still bested most of the other asset classes within fixed income.i As seen last year, once again the lowest quality portion of high yield, CCC rated securities, outperformed their higher quality counterparts. As we have stated many times previously, it is important to note that during 2008 and 2015, CCC rated securities recorded negative returns of 49.53% and 12.11%, respectively. We highlight these returns to point out that with outsized positive returns come outsized possible losses, and the volatility of the CCC rated cohort may not be appropriate for many clients’ risk profile and tolerance levels. During the quarter, the Index option adjusted spread widened 11 basis points moving from 343 basis points to 354 basis points. While the Index spread did break the multi‐year low of 323 basis points set in 2014 by reaching 311 basis points in late January, it is still a ways off from the 233 basis points reached in 2007. Every quality grouping of the High Yield Market participated in the spread widening as BB rated securities widened 26 basis points, B rated securities widened 21 basis points, and CCC rated securities widened 28 basis points.
The Other Financial, Transportation, and Other Industrial Sectors were the best performers during the quarter posting returns of 1.03%, .06%, and .00%, respectively. On the other hand, Banking, Consumer Cyclical, and REITs were the worst performers posting returns of ‐2.49%, ‐1.15%, and ‐1.13%, respectively. At the industry level, tobacco, wirelines, retailers, and healthcare all posted strong returns. The tobacco industry (1.92%) posted the highest return. However, restaurants, wireless, supermarkets, and food & beverage had a rough go of it during the quarter. The restaurant industry (‐2.75%) posted the lowest return.

The Federal Reserve increased the Federal Funds Target Rate three times during 2017. In the first quarter of 2018, Chairman Jerome Powell took over for outgoing Chair Janet Yellen. So far, the Fed has increased the Target Rate just once in 2018 at the March meeting. While the outlook is for three increases this year, Chair Powell plans to “strike a balance between the risk of an overheating economy and the need to keep growth on track.”ii Naturally, the Fed is quite data dependent and the outlook can change as 2018 progresses. While the Target Rate increases tend to have a more immediate impact on the short end of the yield curve, yields on intermediate Treasuries increased 33 basis points over the quarter, as the 10‐year Treasury yield was at 2.74% at March 31st, from 2.41% at the beginning of the quarter. The 5‐year Treasury increased 34 basis points over the quarter, moving to 2.56% at March 31st, from 2.21% at the start of the year. Intermediate term yields more often reflect GDP and expectations for future economic growth and inflation rather than actions taken by the FOMC to adjust the Target Rate. It was the cropping up of inflation concern that was the main driver of the intermediate term yield increase.iii The revised fourth quarter GDP print was 2.9%, and the consensus view of most economists suggests a GDP for 2018 in the upper 2% range with inflation expectations at or above 2%.
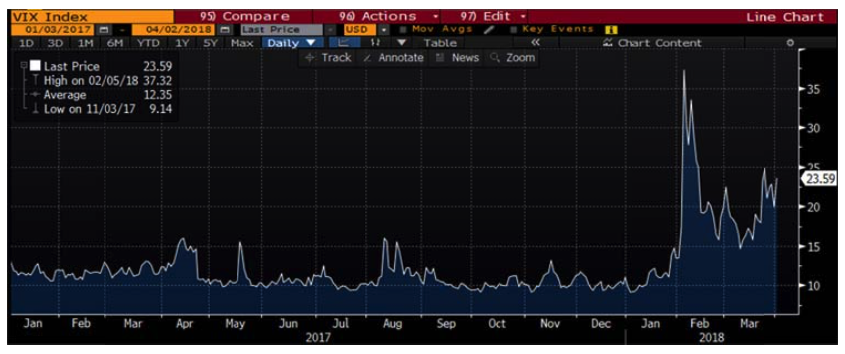
Digging into the monthly details a bit should be beneficial in understanding the dynamics of the quarter. January and February were almost entirely about higher rates and inflation fears, with spreads hitting tights at the end of January and then correcting quite a bit in early February. Mid to late February saw spreads begin to come back down to help offset the continued increase of higher Treasury rates. The return of higher spreads in March was more about tempered growth enthusiasm as retail sales growth continued to be sluggish, January durable goods were weak, Atlanta FED’s GDPNow forecasts continued to slide lower, and fears that global trade wars would slow growth further. Interestingly, the 10 year Treasury yield peaked on February 21st versus the 5 year Treasury peaking a month later on March 20th. That flattening is telling as growth expectations came down while the Fed continues a less accommodative posture. According to Wells Fargo, global quantitative easing has been reduced by 50% from the fourth quarter of 2017 to the first quarter of 2018. Lower rated CCC credits underperformed in March after the outperformance displayed in January and February. As the second quarter gets under way, Treasuries are down from the highs, high yield spreads are off the lows, and higher quality credit seems compelling as lower rated credit has finally started to underperform.

See Accompanying Endnotes
The Administration has taken action to impose tariffs on steel and aluminum. These actions were taken after a US Department of Commerce report on section 232 of the Trade Expansion Act suggested that the tariffs were justified. Several countries are currently exempt from the tariffs, including Canada and Mexico, likely because of the ongoing NAFTA negotiations. However, there seems to be a fair amount of flexibility going forward to manage the duties as the Administration sees fit. China is taking exception to the tariffs and has responded by imposing their own tariffs on 128 different products.v While 128 products is a seemingly high number, it only amounts to about $3 billion which is just a fraction of total trade between the US and China. This appears to be a negotiation tactic and clearly a developing story over the balance of 2018.

The Bloomberg Barclays US Corporate High Yield Index ended the first quarter with a yield of 6.19%. This yield is an average that is barbelled by the CCC rated cohort yielding 9.24% and a BB rated slice yielding 5.09%. The Index yield has become more and more attractive since the third quarter of 2017. While the volatility discussed earlier does lend itself to spread widening and higher yields, there are still positives in the environment to keep in mind. First, the current administration is viewed as pro‐business and the tax reform bill that was passed should provide benefits throughout 2018. Additionally, High Yield has displayed a fundamental backdrop that is stable to improving.vi The default volume did tick up during the first quarter, and the twelve month default rate is currently 2.36%.vii However, the current default rate is still significantly below the historical average. Also, a total of twelve issuers defaulted in the first quarter. Three of those issuers accounted for 74% of the default total. iHeart Communications was the largest to default accounting for 55% of the total. Separate from the uptick in the default ratio, the volume of distressed bonds did tick down in March. That was only the seventh downtick within the past two years. Finally, from a technical perspective, the high yield market generates close to $80 billion in coupon income every year. That is a nice supporting demand factor when facing a more volatile market environment. Due to the historically below average default rates and the higher income available in the High Yield market, it is still an area of select opportunity relative to other fixed income products.
Over the near term, we plan to stay rather selective. The selectiveness should serve our clients well as we navigate the higher volatility environment. Further, if the High Yield market begins to break down, our clients should accrue the benefit of our positioning in the higher quality segments of the market. The market needs to be carefully monitored to evaluate that the given compensation for the perceived level of risk remains appropriate on a security by security basis. It is important to focus on credit research and buy bonds of corporations that can withstand economic headwinds and also enjoy improved credit metrics in a stable to improving economy. As always, we will continue our search for value and adjust positions as we uncover compelling situations.
This information is intended solely to report on investment strategies identified by Cincinnati Asset Management. Opinions and estimates offered constitute our judgment and are subject to change without notice, as are statements of financial market trends, which are based on current market conditions. This material is not intended as an offer or solicitation to buy, hold or sell any financial instrument. Fixed income securities may be sensitive to prevailing interest rates. When rates rise the value generally declines. Past performance is not a guarantee of future results. Gross of advisory fee performance does not reflect the deduction of investment advisory fees. Our advisory fees are disclosed in Form ADV Part 2A. Accounts managed through brokerage firm programs usually will include additional fees. Returns are calculated monthly in U.S. dollars and include reinvestment of dividends and interest. The index is unmanaged and does not take into account fees, expenses, and transaction costs. It is shown for comparative purposes and is based on information generally available to the public from sources believed to be reliable. No representation is made to its accuracy or completeness.
i Credit Sights April 1, 2018: “US Monday Meeting Notes”
ii Reuters February 27, 2018: “First Congressional Testimony by Fed Chair Powell”
iii USA Today February 12, 2018: “U.S. Treasury yields rise to a new 4‐year high as inflation concerns drag on” iv Marketwatch March 28, 2018: “The Dow and S&P 500 have already doubled the number of 1% moves seen in all of 2017”
v CNN April 2, 2018: “China hits the United States with tariffs on $3 billion of exports”
vi Bloomberg March 20, 2018: “Historical Fundamentals – High Yield Corporates”
vii JP Morgan April 2, 2018: “Default Monitor”